
Intraday trading of Comex gold futures requires a disciplined approach, with many active traders relying on short-term technical analysis to navigate rapid price movements. Tools such as the 5-minute bar chart are fundamental for identifying potential entry and exit points by highlighting key support and resistance levels throughout the trading day.
Understanding how to interpret these charts allows traders to make informed decisions based on emerging price strength or weakness. This method focuses exclusively on price action and volume, providing a framework for managing the high-speed environment of the futures market.
Key Takeaways
- Intraday gold trading involves buying and selling Comex gold futures contracts within the same trading session.
- Technical analysis, particularly using short-term charts like the 5-minute bar chart, is a primary tool for day traders.
- Identifying support and resistance levels helps traders determine potential price turning points and set entry or exit orders.
- Common strategies include scalping for small, frequent profits and momentum trading based on strong price trends.
- Effective risk management, including the use of stop-loss orders, is critical to mitigate the high volatility of the gold futures market.
Understanding the Gold Futures Market
Gold futures are standardized contracts that obligate a buyer to purchase, and a seller to sell, a specific quantity of gold at a predetermined price on a future date. These contracts are traded on regulated exchanges, with the Commodity Exchange Inc. (COMEX) being the primary market for gold futures globally.
Intraday trading, also known as day trading, refers to the practice of opening and closing positions in these contracts within a single trading day. The goal is not to take physical delivery of the gold but to profit from small price fluctuations.
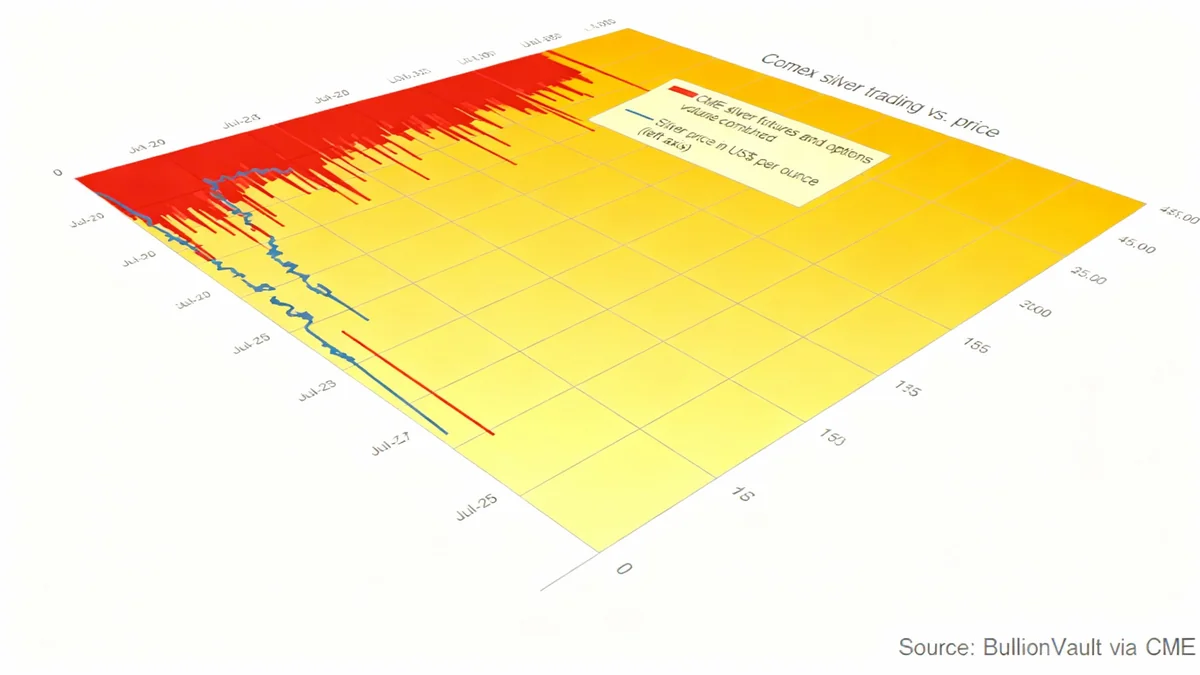
What is COMEX?
COMEX is the primary futures and options market for trading metals such as gold, silver, copper, and aluminum. It is a division of the Chicago Mercantile Exchange (CME) Group. The prices established on COMEX serve as a benchmark for the global gold market.
Why Traders Focus on Short-Term Movements
Unlike long-term investors who may hold assets for months or years based on fundamental factors like inflation or geopolitical stability, intraday traders focus on immediate price action. Their success depends on capitalizing on volatility that occurs over minutes or hours.
This approach requires a different set of tools and a mindset geared toward rapid execution. Technical analysis becomes the primary lens through which the market is viewed, as it provides real-time data on supply and demand dynamics reflected in price and volume.
The Role of the 5-Minute Bar Chart
For an active day trader, the 5-minute bar chart is an essential tool. Each bar on the chart represents five minutes of trading activity, providing a detailed yet manageable view of the market's pulse. This timeframe is short enough to capture significant intraday volatility but long enough to filter out some of the random noise present on 1-minute charts.
How to Read a Bar Chart
A bar chart provides four key pieces of information for each five-minute interval:
- The Open: The price at the beginning of the period, marked by a small horizontal line on the left side of the bar.
- The High: The highest price reached during the period, represented by the top of the vertical bar.
- The Low: The lowest price reached, marked by the bottom of the vertical bar.
- The Close: The final price at the end of the period, shown as a small horizontal line on the right side of the bar.
By analyzing the relationship between these four points, traders can gauge market sentiment. A bar that closes higher than its open indicates buying pressure, while a close below the open suggests selling pressure.
A standard COMEX gold futures contract (GC) represents 100 troy ounces of gold. Therefore, a $1 move in the price of gold translates to a $100 profit or loss per contract.
Identifying Support and Resistance Levels
One of the most fundamental concepts in technical analysis is the identification of support and resistance. These are price levels where the market has historically shown a tendency to pause or reverse.
Support is a price level where demand is thought to be strong enough to prevent the price from falling further. When the price of gold approaches a support level, traders watch to see if buyers will step in and push the price back up.
Resistance is the opposite; it is a price level where selling pressure is expected to be strong enough to prevent the price from rising further. As the price nears a resistance level, sellers may enter the market, causing the upward trend to stall.
Finding Levels on an Intraday Chart
On a 5-minute chart, support and resistance levels can be identified in several ways:
- Previous Highs and Lows: The highest and lowest points reached earlier in the trading session often act as natural resistance and support.
- Pivot Points: These are calculated levels based on the previous day's high, low, and close prices. They provide predetermined levels to watch for potential reversals.
- Price Consolidation: Areas where the price has traded sideways for an extended period can signal strong support or resistance zones.
Traders use these levels to plan their trades, often placing buy orders near support and sell or short-sell orders near resistance.
Executing Trades Based on Price Action
A common principle among successful short-term traders is to buy on early signs of strength and sell on early signs of weakness. This means not waiting for a trend to be fully confirmed, as much of the potential profit may have already passed.
"The goal of a day trader is to get in and out of the market quickly. Waiting for perfect confirmation often means you're too late to the party. The key is to identify momentum as it begins to build."
Strategies for Entry and Exit
When the price of gold approaches a support level, a trader might look for signs of buying strength, such as a bar that closes significantly above its open. This could serve as a signal to enter a long (buy) position, with a stop-loss order placed just below the support level to limit potential losses.
Conversely, as the price approaches a resistance level, signs of selling pressure (like a bar closing near its low) might signal an opportunity to enter a short (sell) position. The stop-loss would be placed just above the resistance level.
This disciplined approach, which combines chart analysis with strict risk management, is fundamental to navigating the volatile gold futures market on an intraday basis.
The Importance of Risk Management
While technical analysis provides a roadmap, it does not guarantee profits. The gold market can be influenced by sudden news events or unexpected shifts in volume, leading to rapid and unpredictable price swings. Because of this, risk management is arguably the most critical component of intraday trading.
Every trade should have a predefined exit plan for both a profitable and a losing scenario. Using stop-loss orders is non-negotiable for most professional traders, as it automatically closes a position if the price moves against them by a certain amount. This prevents a single bad trade from causing significant damage to a trading account.