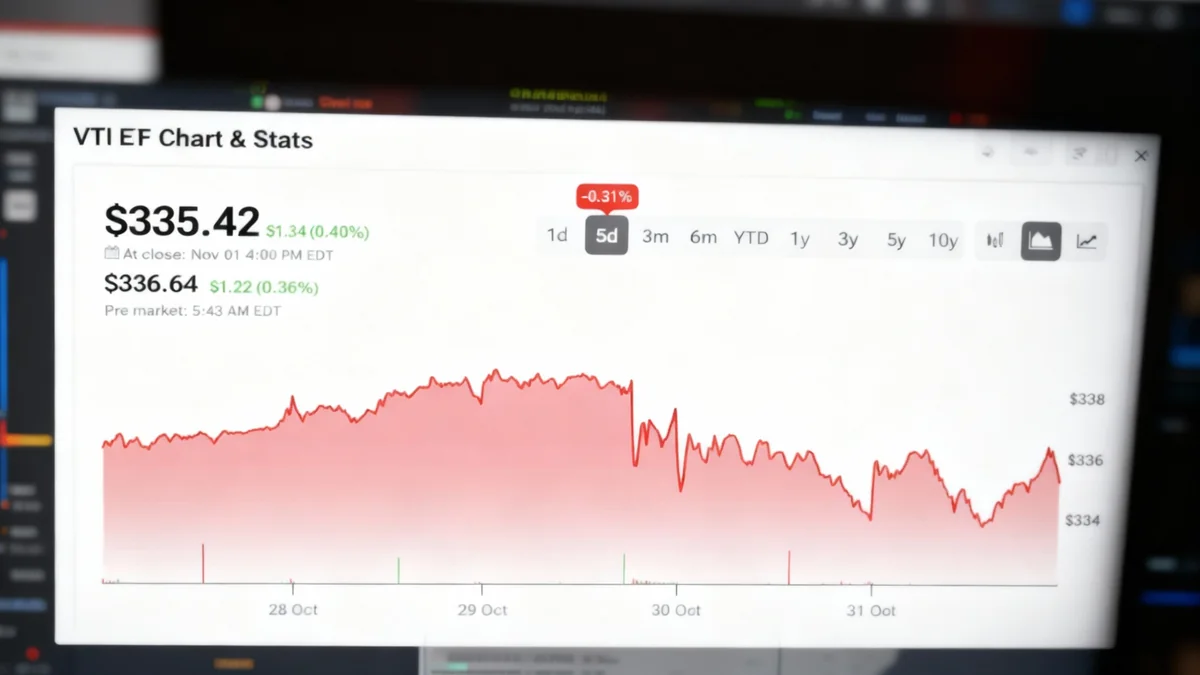

The Vanguard Total Stock Market ETF (VTI), a popular fund designed to mirror the entire U.S. stock market, has attracted significant investor capital, with net inflows reaching $1 billion over the last five trading days. This surge in interest comes as the fund posts a year-to-date gain of 16.82%, reflecting broader market strength.
Despite a minor dip of 0.31% over the past week, the fund's recent performance and technical indicators suggest a positive outlook among market participants. On Friday, VTI closed up 0.40%, moving in line with gains in the S&P 500 and the Nasdaq Composite, which were buoyed by strong earnings from major technology companies.
Key Takeaways
- The VTI ETF recorded $1 billion in net capital inflows over the past five trading sessions.
- The fund has achieved a 16.82% gain year-to-date, despite a slight recent downturn.
- Technical analysis indicates a bullish trend, with VTI trading above its 50-day exponential moving average.
- Top holdings include technology giants Nvidia, Microsoft, and Apple, highlighting the fund's significant exposure to the tech sector.
- Analyst consensus rates VTI as a 'Moderate Buy' with a potential upside of 14.65% based on average price targets.
Understanding the Appeal of VTI
For investors seeking broad exposure to the U.S. economy, the Vanguard Total Stock Market ETF offers a comprehensive solution. Rather than picking individual stocks, VTI allows investors to buy a small piece of thousands of U.S. companies, from the largest corporations to smaller, emerging businesses. This diversification is a core reason for its popularity.
An Exchange-Traded Fund (ETF) like VTI trades on stock exchanges, similar to individual stocks. This structure provides liquidity and makes it easy for investors to buy and sell shares throughout the trading day. VTI aims to track the performance of the CRSP US Total Market Index, offering a benchmark for the entire U.S. equity market in a single investment vehicle.
What is a Total Market ETF?
A total stock market ETF is a fund that aims to hold a representative sample of all publicly traded stocks in a specific country's market. By investing in such a fund, you gain exposure to large-cap, mid-cap, and small-cap companies, effectively diversifying your investment across thousands of securities and reducing single-stock risk.
Recent Performance and Market Activity
While the fund has demonstrated strong performance throughout the year, recent market activity provides a closer look at investor sentiment. The fund's three-month average trading volume stands at 4.05 million shares, indicating consistent liquidity and active trading.
The most notable recent statistic is the $1 billion in net flows into the fund over the last five days. This figure suggests that despite minor price fluctuations, investors are, on the whole, adding new capital to VTI, signaling confidence in the long-term prospects of the U.S. stock market.
Friday's 0.40% gain for VTI coincided with positive market movements, including a 0.60% rise in the Nasdaq Composite and a 0.3% increase in the S&P 500. This performance was largely influenced by strong quarterly results from technology leader Amazon, which underscores the significant impact of large-cap tech stocks on broad market indices and, consequently, on VTI itself.
Technical Indicators Signal Bullish Trend
From a technical analysis perspective, VTI is currently showing signs of strength. The fund is trading at $335.42, which is comfortably above its 50-day exponential moving average (EMA) of $325.83. Traders often view a security trading above its 50-day EMA as a bullish signal, suggesting positive short-to-medium-term momentum.
Moving Averages Explained
A 50-day moving average is a technical indicator that shows the average closing price of a security over the last 50 trading days. It is used to identify the current trend direction. When a price is above its moving average, it is often interpreted as an uptrend.
This positive momentum has contributed to a 'Strong Buy' rating based on a summary of technical analysis indicators. The consensus from moving averages also points toward a buy signal, reinforcing the current bullish sentiment surrounding the ETF.
A Look Inside VTI's Holdings
To understand VTI's performance, it is essential to examine its underlying assets. The ETF's portfolio is heavily weighted towards the technology sector, which has been a primary driver of market growth. The top three holdings are:
- Nvidia (NVDA): 6.69% of the fund
- Microsoft (MSFT): 5.98% of the fund
- Apple (AAPL): 5.87% of the fund
The significant allocation to these three technology giants means that their performance has a substantial impact on VTI's overall value. While this provides exposure to some of the market's most dynamic companies, it also ties the fund's fortunes closely to the tech industry.
Analyst Outlook and Price Forecasts
Analysts provide a 'Moderate Buy' consensus for VTI, which is determined by a weighted average of the ratings on all the individual stocks held within the fund. The average price target for VTI's holdings suggests a potential upside of 14.65%, with a target price of $384.56.
The collective analyst outlook reflects a cautiously optimistic view of the U.S. stock market, acknowledging both the growth potential driven by leading companies and the inherent risks of broad market exposure.
While top holdings like Nvidia and Microsoft dominate the fund, analysts see significant upside potential in some of VTI's smaller components. Companies such as FlexShopper (FPAY), FibroBiologics (FBLG), and Biodesix (BDSX) are among the holdings with the highest projected growth. Conversely, some holdings, including Opendoor Technologies (OPEN) and GoPro (GPRO), have been identified as having greater downside potential, highlighting the diversified nature of the fund's risk profile.